GBC Sene_Signature
Senescence Signature
Sene_Signature
Immunity
SNP&CNV
MicroRNA
Methylation
Clinical
Drug
Download
Analyzing the differences in clinic among different "Sene_Signature" groups
Your own dataset
Test data download
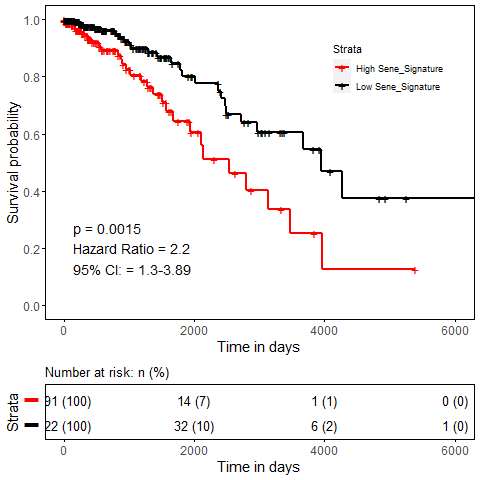
Survival
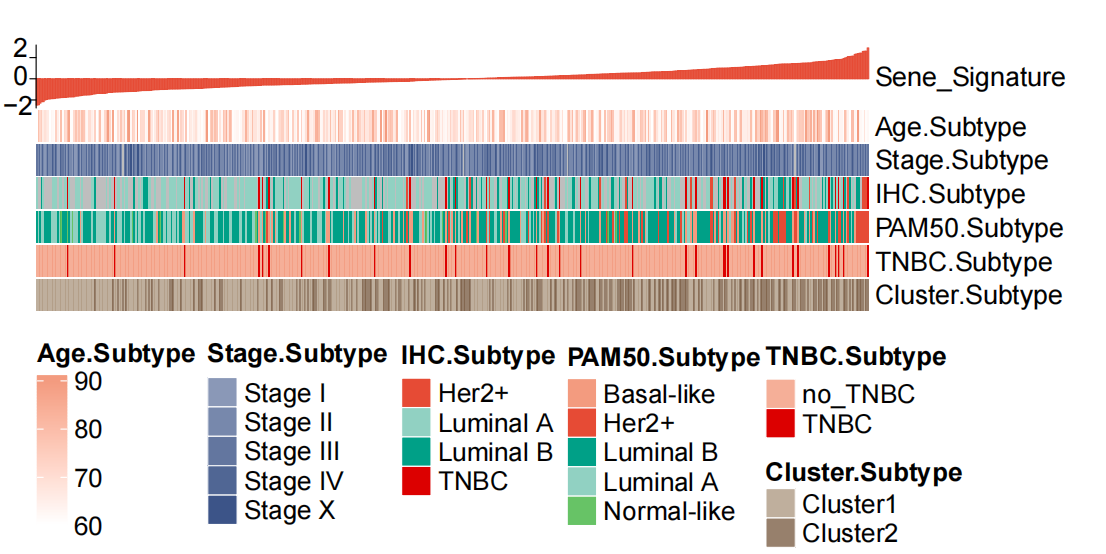
Heatmap displays clinical information of patients with different "Sene_Signature"
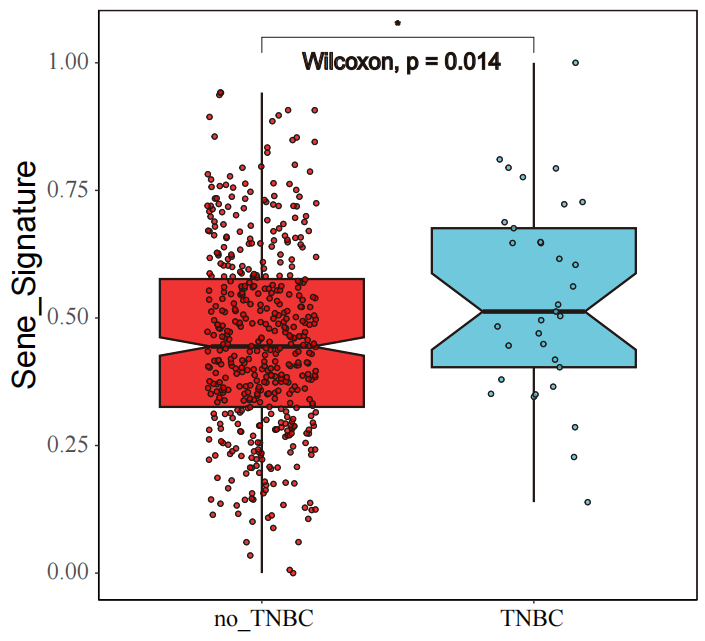
The box chart of "Sene_Signature" difference between TNBC and no_TNBC
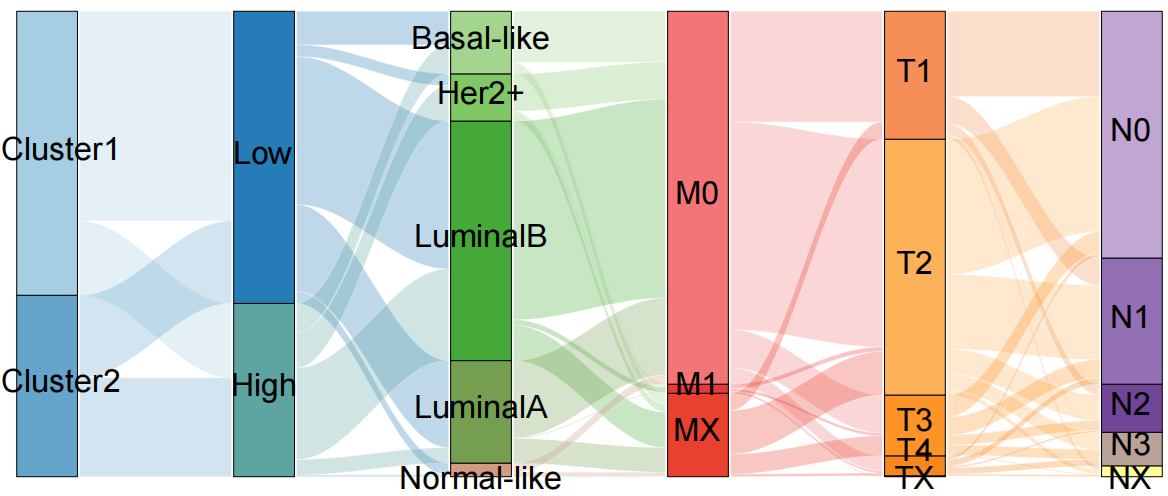
The sample information table is represented by the Sankey plot